
Yesterday I was discussing the web’s GAIN of available information compared to the pre-digital age. There are also LOSSES in functionality compared to the digital pre-web era.
Today’s courseware work reminds me again of what we lost when programs switched from Windows to the web. The text’s author wants me to bring back part of a lesson that was last done in Windows form. My old courseware engine had all sorts of unique animation and calculation features that simply CAN’T be duplicated in html.
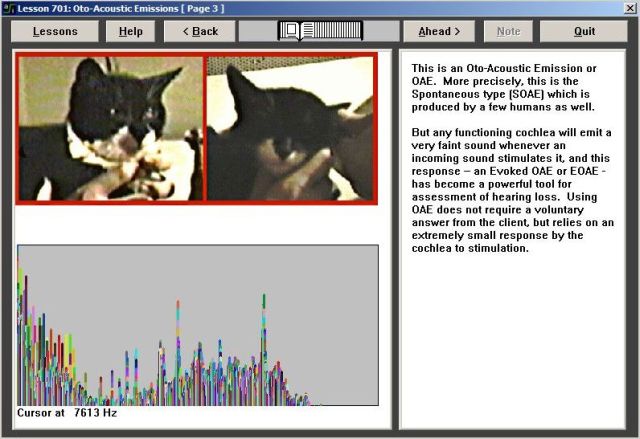
It contained a spectrogram generator with clickable cursor to show the frequency.
There was an interactive airflow animator and wave calculator. You could change the frequency or amplitude, and see how the waves in the air and the cochlea changed in response.

I can screencap the spectrogram and show it as a plain image. I can include the sound as an html audio tag. There’s no way to MAKE a spectrogram and show the frequency. There’s no way to animate waves and airflow interactively. Fortunately the author doesn’t need that part, just the story of the cat and the sound and spectrogram of its oto-acoustic emission.
On a personal level, redoing this part shows me that my own aging ears have lost functionality since I first built the lesson in 2002. Here’s the sound. The recording was made in a noisy location with a loud vent fan dominating the waveform and spectrogram. The oto-acoustic emission is a small high frequency tone, 7k as shown by the cursor on the peak. In 2002 I could hear the 7k along with the vent fan buzzing. Now I can’t hear the 7k.
Now there are specialized instruments for measuring OAE, with sensitive microphones in the ear canal. Those instruments weren’t available in 1989 when the recording was made. At that time the subject was still mostly experimental.
